
Marks Manager: Marks and Reports
This section of the Marks Manager allows marks and reports to be displayed and printed.
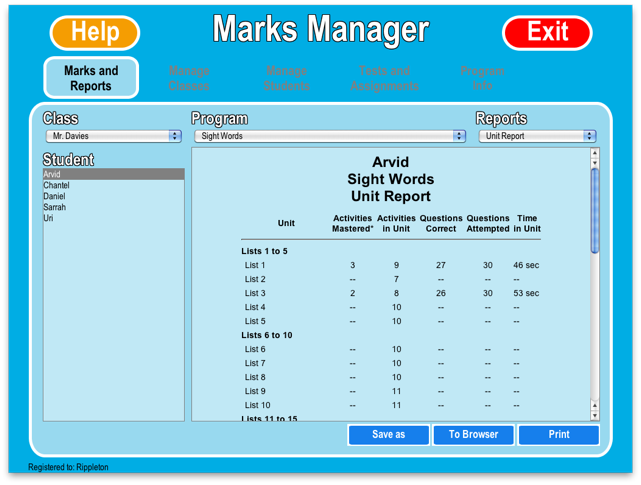
Using the drop-down menus near the top of the screen, select the desired class, program and report type that you want to access (report types are outlined below). Then in the panel on the left hand side, select the desired student. The selected report will then display in the right-hand side panel.
Buttons
Save As This will save a report as an HTML file that can be opened later by any web browser. When saving a graph report as an HTML file an image file is also saved. These two files need to be in the same folder for a browser to display the report properly.
To Browser This will open the report in your default web browser to provide you with a larger display area.
Print This will allow you to choose a printer and then print the report.
Report Types
To understand the reports you will need to be familiar with the terminology used to describe the content of a program. Each program consists of Modules, Units, and Activities. Modules correspond to top-level menu items, they are the smallest unit of content that can be assigned to a student. Each Module contains a number of Units, which may contain some combination Units and Activities. Activities are what the student actually does.
Another term used throughout the reports is "mastery". When a student achieves a score of 80% or better for an activity the activity is considered "mastered".
Unit Report Shows the number of activities mastered, the number of questions answered correctly, the number of questions attempted and overall time spent in each unit of the program.
Pre-Test Report Using data from the Pre-Test, this report shows the modules tested, the number questions answered correctly, the number of questions attempted, the score time and the modules assigned to the student.
Skill Report Broken down by individual skills, this report lists the number of correctly answered questions and the number of attempted questions.
Class Report This report lists all students in the selected class. For each student, data is displayed detailing the number of activities mastered, the number of correctly answered questions, the number of attempted questions, the total time spent in the program and the current module being worked on.
Hotspot Report A "hotspot" is an activity that has been attempted by the student three times without mastery. The hotspot report notes how many hotspots vs. total activities attempted there are in total for the student. The report goes on to list the unit name and activity name for each hotspot, along with the number of attempts, the average mark and time spent in it.
Graph Reports
These three graph reports are organized by program unit and detail: the average time in seconds the student took in answering each question; the percentage complete per program module and the percentage of questions answered accurately.
Program Graph Shows a students work for the selected programs modules.
Unit Graph Shows a students work for the selected programs units.
Comparison Graph Shows the work done for each student in a class for the selected program.